Distributed Tuning
The second approach to shorten the time to the next decision is to decrease the time per experiment. This can be done, to some extent, by increasing the number of workers, i.e. the number of trials which are run in parallel. In this section, we show how this can be done.
Note
Imports in our scripts are absolute against the root package
transformer_wikitext2, so that only the code in
benchmarking.nursery.odsc_tutorial has to be present. In order to run
them, you need to append <abspath>/odsc_tutorial/ to the PYTHONPATH
environment variable. This is required even if you have installed Syne Tune
from source.
Comparing Different Numbers of Workers
Our study above was done with 4 workers. With the local backend, an experiment with all its workers runs on a single instance. We need to select an instance type with at least 4 GPUs, and each training script can use one of them only.
Syne Tune provides another backend,
SageMakerBackend, which executes each trial as a
separate SageMaker training job. This allows you to decouple the number of
workers from the instance type. In fact, for this backend, the default
instance type for our benchmark is ml.g4dn.xlarge, which has a single
GPU and is cheaper to run than ml.g4dn.12xlarge we used with the
local backend above.
In order to showcase the SageMaker backend, we run a second study in order
to compare our 4 methods RS, BO, ASHA, and MOBSTER using
a variable number of workers (2, 4, 8). Here, max_wallclock_time is 5
hours for 4, 8 workers, but double that (10 hours) for 2 workers. Using the
SageMaker backend instead of the local one only requires a minimal change
in the launcher scripts:
from transformer_wikitext2.baselines import methods
from transformer_wikitext2.benchmark_definitions import benchmark_definitions
from syne_tune.experiments.launchers.hpo_main_sagemaker import main


if __name__ == "__main__":
    main(methods, benchmark_definitions)
from pathlib import Path

from transformer_wikitext2.baselines import methods
from transformer_wikitext2.benchmark_definitions import benchmark_definitions
from syne_tune.experiments.launchers.launch_remote_sagemaker import launch_remote


if __name__ == "__main__":
    entry_point = Path(__file__).parent / "hpo_main.py"
    source_dependencies = [str(Path(__file__).parent.parent)]
    launch_remote(
        entry_point=entry_point,
        methods=methods,
        benchmark_definitions=benchmark_definitions,
        source_dependencies=source_dependencies,
    )
We import from hpo_main_sagemaker and launch_remote_sagemaker instead
of hpo_main_local and launch_remote_local. Here is how the experiments
are launched (replace ... by the absolute path to odsc_tutorial):
export PYTHONPATH="${PYTHONPATH}:/.../odsc_tutorial/"
python benchmarking/nursery/odsc_tutorial/transformer_wikitext2/sagemaker/launch_remote.py \
  --experiment_tag tmlr-10 --benchmark transformer_wikitext2 \
  --random_seed 2938702734 --scale_max_wallclock_time 1 \
  --num_seeds 5 --n_workers <n-workers>
Here, <n_workers> is 2, 4, 8 respectively.
We run 5 random repetitions (seeds), therefore 20 experiments per value of
<n_workers>.Running the experiments for
<n_workers>requires a resource limit larger or equal to<n_workers> * 20for instance typeml.g4dn.xlarge. If your limit is less than this, you should launch fewer experiments in parallel, since otherwise most of the experiments will not be able to use<n_workers>workers.With
--scale_max_wallclock_time 1, we adjustmax_wallclock_timeifn_workersis smaller than the default value (4) for our benchmark. In our example, the case--n_workers 2runs for 10 hours instead of 5.
Once all experiments are finished, with results written to S3, we can create a plot comparing the performance across different numbers of workers, using the following script:
from typing import Dict, Any, Optional
import logging

from transformer_wikitext2.benchmark_definitions import benchmark_definitions
from syne_tune.experiments import ComparativeResults, PlotParameters, SubplotParameters


TMLR10_SETUPS = [
    "2 workers",
    "4 workers",
    "8 workers",
]


def metadata_to_setup(metadata: Dict[str, Any]) -> Optional[str]:
    return f"{metadata['n_workers']} workers"


TMLR10_METHOD_TO_SUBPLOT = {
    "RS": 0,
    "BO": 1,
    "ASHA": 2,
    "MOBSTER": 3,
}


def metadata_to_subplot(metadata: dict) -> Optional[int]:
    return TMLR10_METHOD_TO_SUBPLOT[metadata["algorithm"]]


if __name__ == "__main__":
    logging.getLogger().setLevel(logging.INFO)
    experiment_names = ("tmlr-10",)
    num_runs = 5
    download_from_s3 = False  # Set ``True`` in order to download files from S3
    # Plot parameters across all benchmarks
    plot_params = PlotParameters(
        xlabel="wall-clock time",
        aggregate_mode="iqm_bootstrap",
        grid=True,
    )
    # We would like to have 4 subfigures, one for each method
    plot_params.subplots = SubplotParameters(
        nrows=2,
        ncols=2,
        kwargs=dict(sharex="all", sharey="all"),
        titles=["RS", "BO", "ASHA", "MOBSTER"],
        title_each_figure=True,
        legend_no=[0],
    )
    # The creation of ``results`` downloads files from S3 (only if
    # ``download_from_s3 == True``), reads the metadata and creates an inverse
    # index. If any result files are missing, or there are too many of them,
    # warning messages are printed
    results = ComparativeResults(
        experiment_names=experiment_names,
        setups=TMLR10_SETUPS,
        num_runs=num_runs,
        metadata_to_setup=metadata_to_setup,
        plot_params=plot_params,
        metadata_to_subplot=metadata_to_subplot,
        download_from_s3=download_from_s3,
    )
    # Create comparative plot (single panel)
    benchmark_name = "transformer_wikitext2"
    benchmark = benchmark_definitions(sagemaker_backend=True)[benchmark_name]
    # These parameters overwrite those given at construction
    plot_params = PlotParameters(
        metric=benchmark.metric,
        mode=benchmark.mode,
        ylim=(5, 8),
    )
    results.plot(
        benchmark_name=benchmark_name,
        plot_params=plot_params,
        file_name=f"./odsc-comparison-sagemaker-{benchmark_name}.png",
    )
For details about visualization of results in Syne Tune, please consider this tutorial. In a nutshell:
Different to the plot above, we have four subplots here, one for each method. In each subplot, we compare results for different numbers of workers.
metadata_to_subplotconfigures grouping w.r.t. subplot (depends on method), whilemetadata_to_setupconfigures grouping w.r.t. each curve shown in each subplot (depends onn_workers).
Here is the plot:
|
|---|
Comparison of methods on transformer_wikitext2 benchmark, using the SageMaker backend with 2, 4, 8 workers. |
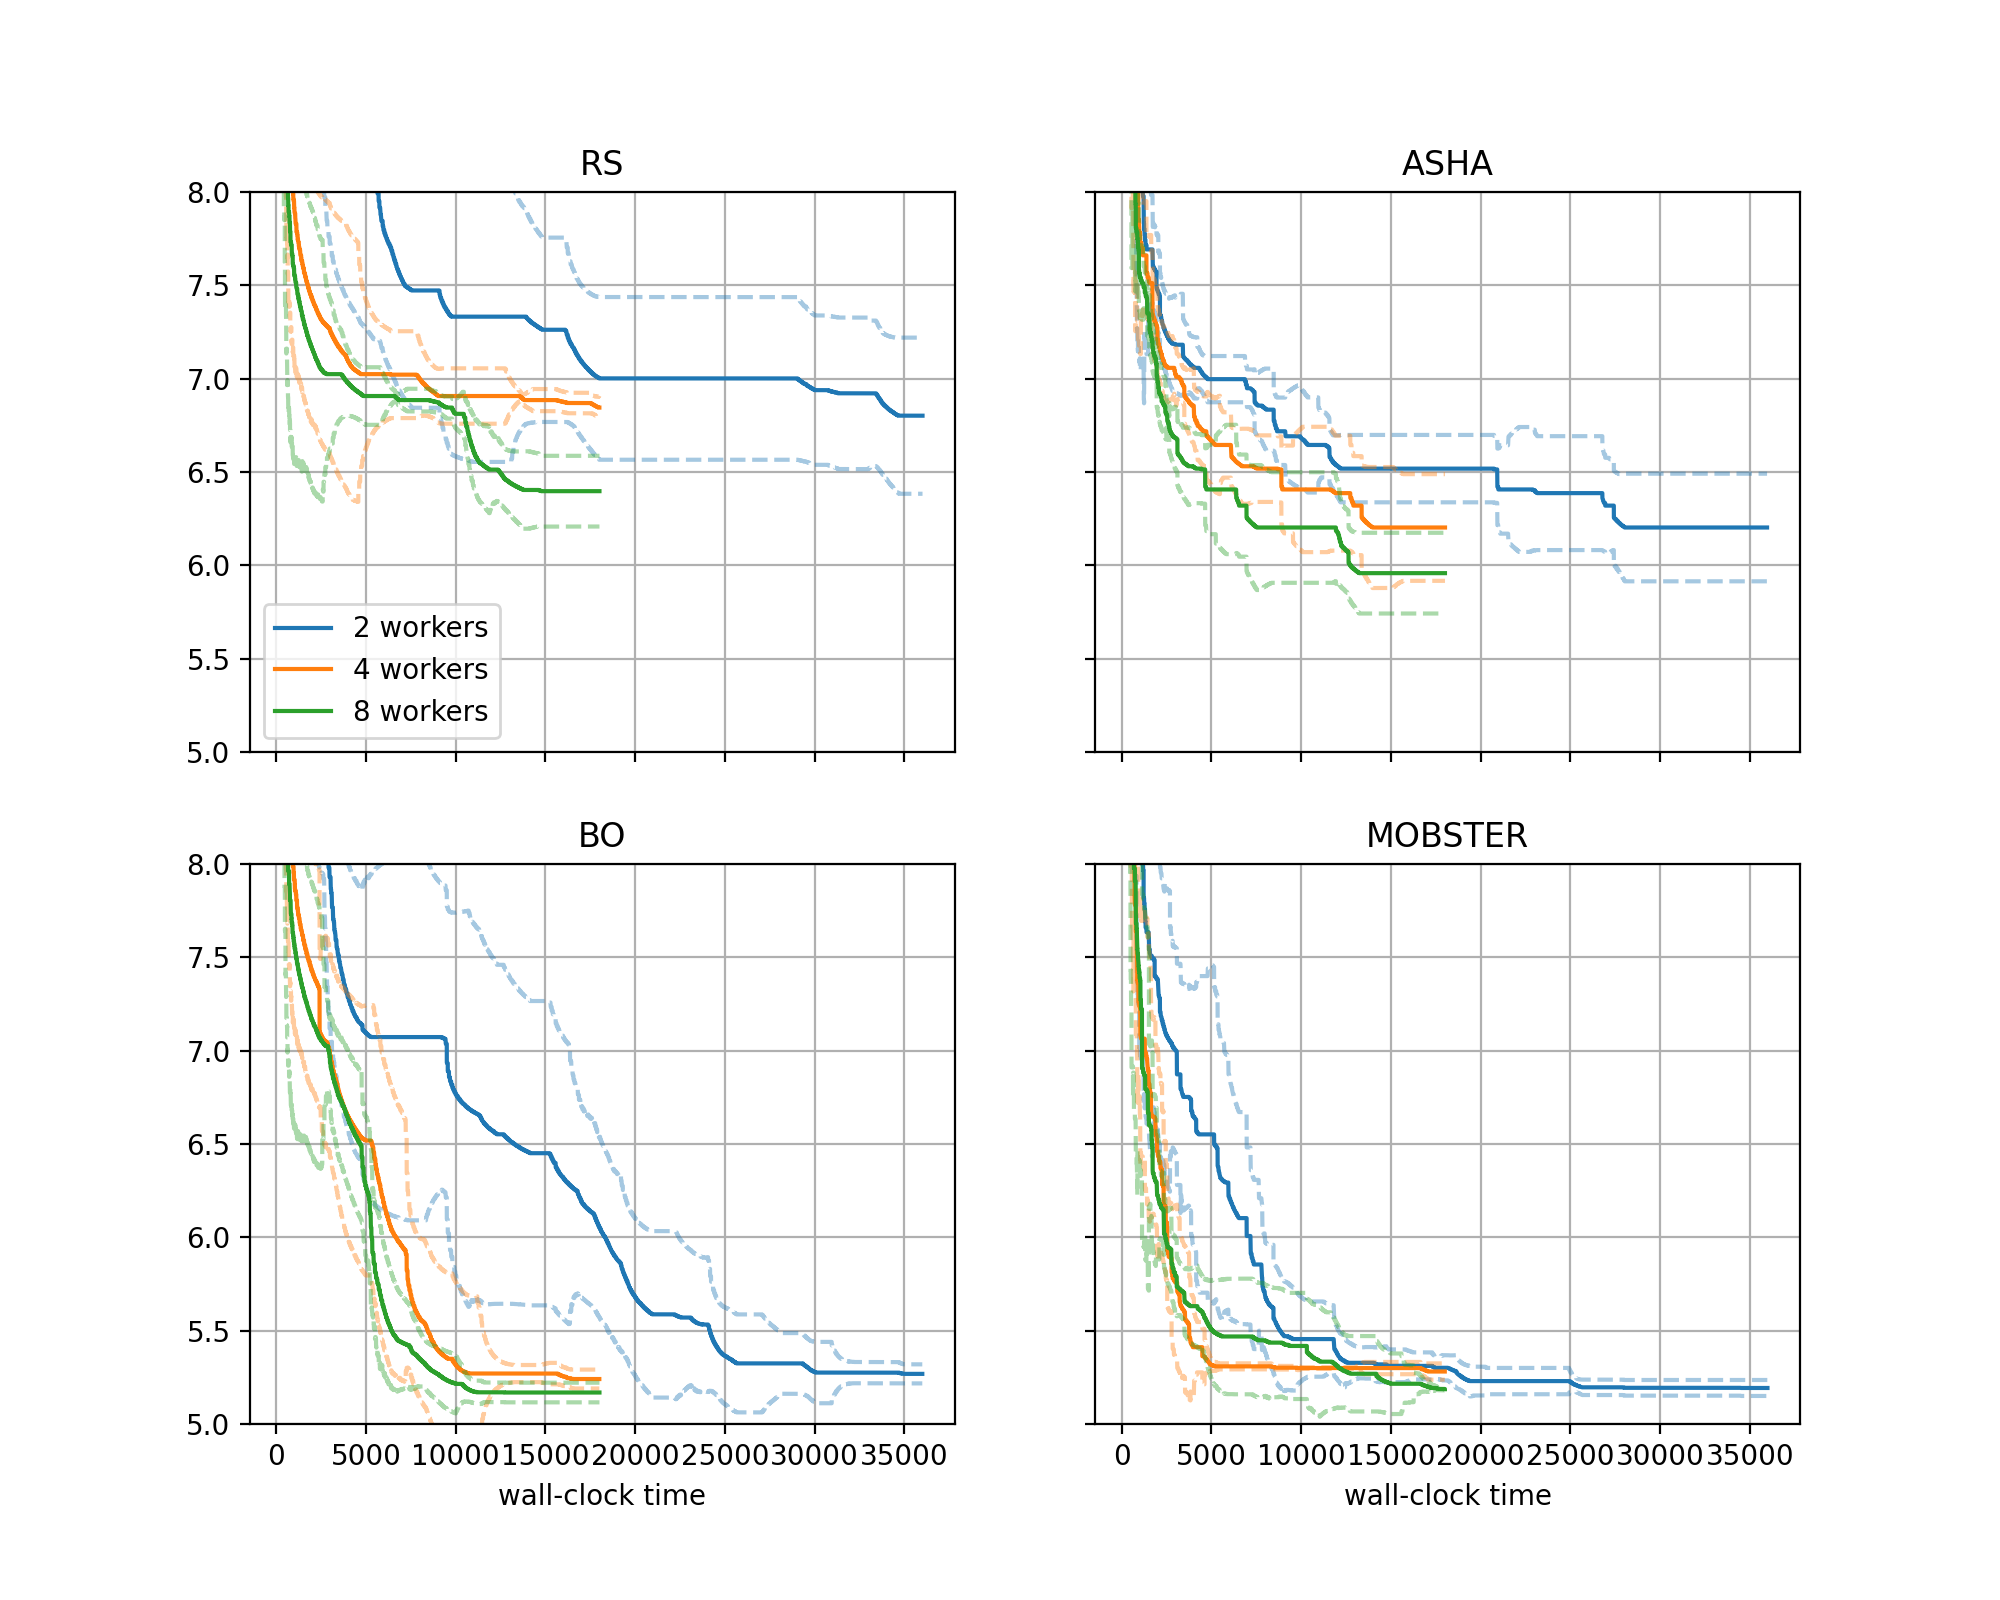
In general, we obtain good results faster with more workers. However, especially for
BOandMOBSTER, the improvements are less pronounced than one might expect.Our results counter a common misconception, that as we go to higher degrees of parallelization of trials, the internals of the HPO method do not matter anymore, and one might as well use random search. This is certainly not the case for our problem, where
BOwith 2 workers attains a better performance after 5 hours thanRSwith 8 workers, at a quarter of the cost.