Drilling Down on Performance Differences
Often, we would like to gain an understanding about why one method performs better than another on a given problem. In this section, we show another type of visualization which can shed some light on this question.
Plotting Learning Curves per Trial
A useful step towards understanding performance differences between setups is to look at the learning curves of trials. Here is a script for creating such plots for the methods compared in our study:
from typing import Dict, Any, Optional
import logging

from transformer_wikitext2.baselines import methods
from transformer_wikitext2.benchmark_definitions import benchmark_definitions
from syne_tune.experiments import (
    TrialsOfExperimentResults,
    PlotParameters,
    MultiFidelityParameters,
    SubplotParameters,
)


SETUPS = list(methods.keys())


def metadata_to_setup(metadata: Dict[str, Any]) -> Optional[str]:
    return metadata["algorithm"]


if __name__ == "__main__":
    logging.getLogger().setLevel(logging.INFO)
    experiment_names = ("odsc-1",)
    seed_to_plot = 0
    download_from_s3 = False  # Set ``True`` in order to download files from S3

    # Plot parameters across all benchmarks
    plot_params = PlotParameters(
        xlabel="wall-clock time",
        grid=True,
    )
    # We need to provide details about rung levels of the multi-fidelity methods.
    # Also, all methods compared are pause-and-resume
    multi_fidelity_params = MultiFidelityParameters(
        rung_levels=[1, 3, 9, 27, 40],
        multifidelity_setups={"ASHA": True, "MOBSTER": True},
    )
    # We would like to have 4 subfigures, one for each method
    plot_params.subplots = SubplotParameters(
        nrows=2,
        ncols=2,
        kwargs=dict(sharex="all", sharey="all"),
        titles=SETUPS,
        title_each_figure=True,
    )
    # The creation of ``results`` downloads files from S3 (only if
    # ``download_from_s3 == True``), reads the metadata and creates an inverse
    # index. If any result files are missing, or there are too many of them,
    # warning messages are printed
    results = TrialsOfExperimentResults(
        experiment_names=experiment_names,
        setups=SETUPS,
        metadata_to_setup=metadata_to_setup,
        plot_params=plot_params,
        multi_fidelity_params=multi_fidelity_params,
        download_from_s3=download_from_s3,
    )

    # Create plot for certain benchmark and seed
    benchmark_name = "transformer_wikitext2"
    benchmark = benchmark_definitions(sagemaker_backend=True)[benchmark_name]
    # These parameters overwrite those given at construction
    plot_params = PlotParameters(
        metric=benchmark.metric,
        mode=benchmark.mode,
    )
    results.plot(
        benchmark_name=benchmark_name,
        seed=seed_to_plot,
        plot_params=plot_params,
        file_name=f"./odsc-learncurves-local-seed{seed_to_plot}.png",
    )
Full details about visualization of results in Syne Tune are given in this tutorial. In a nutshell, this is what happens:
The workflow is similar to comparative plots, but here, each setup occupies a different subfigure, and there is no aggregation over seeds (the seed has to be specified in
results.plot).Two of the methods compared are multi-fidelity (ASHA, MOBSTER), which is why additional information has to be passed as
multi_fidelity_params. This is because learning curves are plotted differently for single-fidelity, multi-fidelity of early stopping and of pause-and-resume type.With
plot_params.subplots, we ask for a two-by-two matrix of subfigures. By default, subfigures are oriented as a single row.
|
|---|
Learning curves of trials for different methods on transformer_wikitext2 benchmark, using the local backend with 4 workers. |
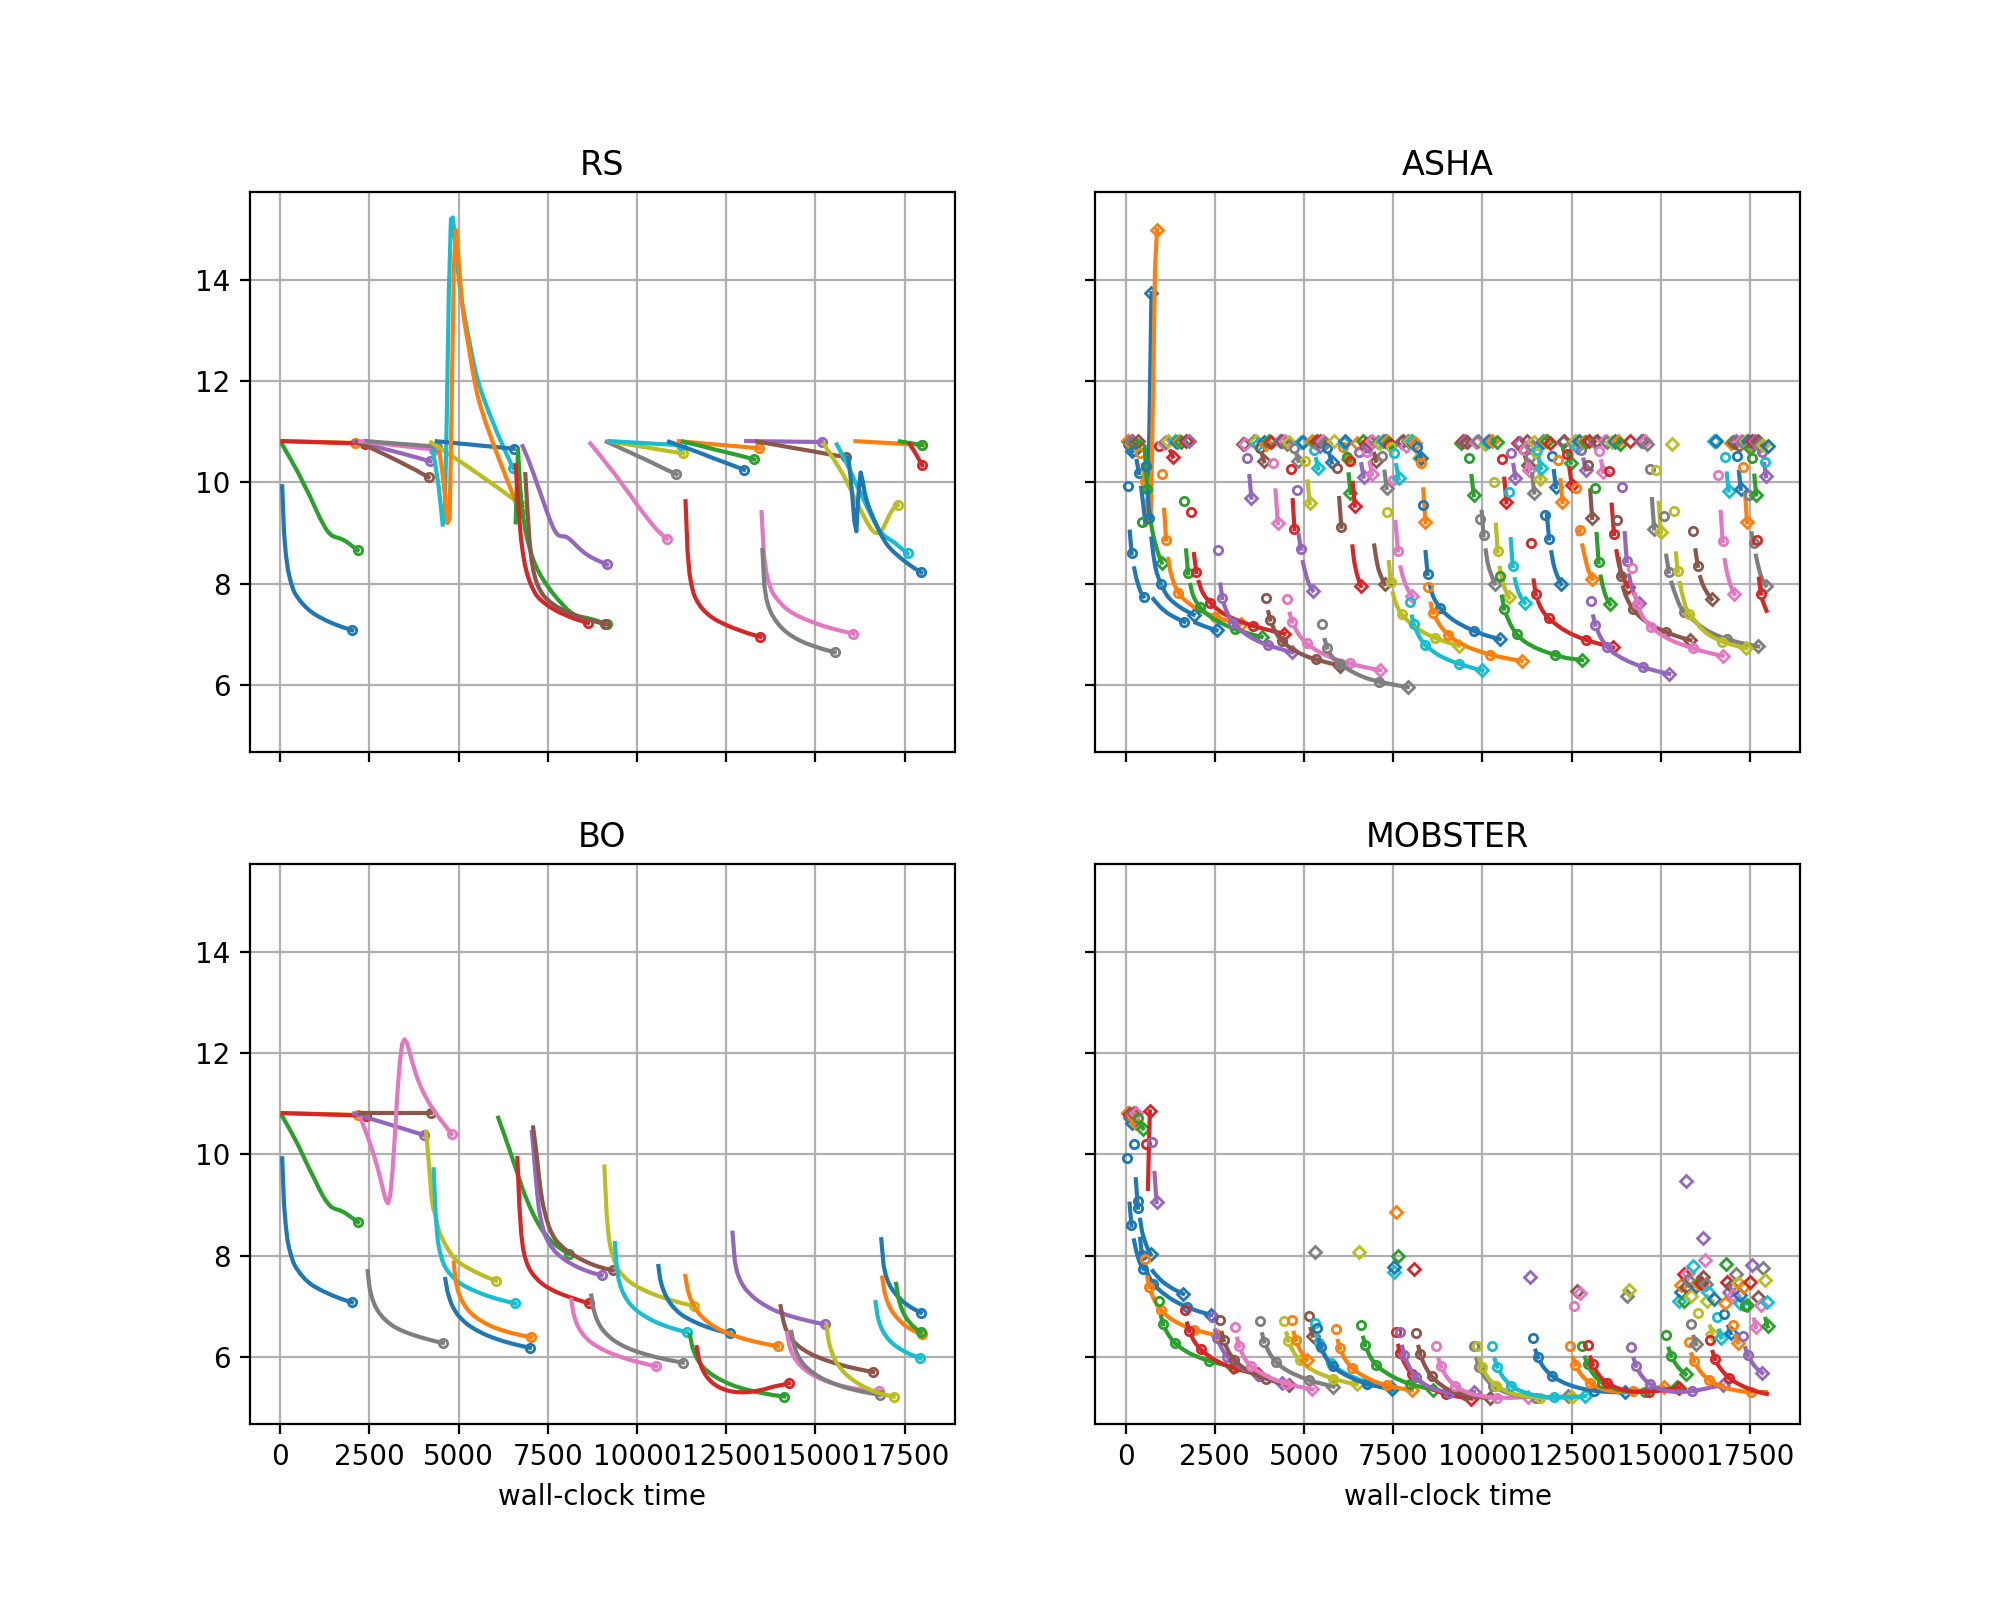
Learning curves of different trials are plotted in different colors.
For ASHA and MOBSTER, learning curves are interrupted by pauses at rung levels, and in some cases resume later. Single markers are trials run for a single epoch only.
Comparing RS with BO, we see that BO learns to avoid early mistakes rapidly, while RS samples poorly performing configurations at a constant rate.
Comparing RS with ASHA, we see that ASHA stops poor trials early, so can explore more configurations, but still suffers from repeating mistakes over and over.
Comparing BO with MOBSTER, both clearly learn from the past. However, MOBSTER pauses suboptimal configurations earlier, which allows it to find very good configurations earlier than BO (in about half the time).
With a small modification of the script, we can plot pairs of subfigures for side-by-side comparisons:
from typing import Dict, Any, Optional
import logging

from transformer_wikitext2.baselines import methods
from transformer_wikitext2.benchmark_definitions import benchmark_definitions
from syne_tune.experiments import (
    TrialsOfExperimentResults,
    PlotParameters,
    MultiFidelityParameters,
    SubplotParameters,
)


SETUPS = list(methods.keys())


def metadata_to_setup(metadata: Dict[str, Any]) -> Optional[str]:
    return metadata["algorithm"]


if __name__ == "__main__":
    logging.getLogger().setLevel(logging.INFO)
    experiment_names = ("odsc-1",)
    seed_to_plot = 0
    download_from_s3 = False  # Set ``True`` in order to download files from S3

    # Plot parameters across all benchmarks
    plot_params = PlotParameters(
        xlabel="wall-clock time",
        grid=True,
        ylim=(5, 13),
    )
    # We need to provide details about rung levels of the multi-fidelity methods.
    # Also, all methods compared are pause-and-resume
    multi_fidelity_params = MultiFidelityParameters(
        rung_levels=[1, 3, 9, 27, 40],
        multifidelity_setups={"ASHA": True, "MOBSTER": True},
    )
    # The creation of ``results`` downloads files from S3 (only if
    # ``download_from_s3 == True``), reads the metadata and creates an inverse
    # index. If any result files are missing, or there are too many of them,
    # warning messages are printed
    results = TrialsOfExperimentResults(
        experiment_names=experiment_names,
        setups=SETUPS,
        metadata_to_setup=metadata_to_setup,
        plot_params=plot_params,
        multi_fidelity_params=multi_fidelity_params,
        download_from_s3=download_from_s3,
    )

    # Create plots for certain benchmark and seed
    benchmark_name = "transformer_wikitext2"
    benchmark = benchmark_definitions(sagemaker_backend=True)[benchmark_name]
    # These parameters overwrite those given at construction
    plot_params = PlotParameters(
        metric=benchmark.metric,
        mode=benchmark.mode,
    )
    for indices, name in [
        ([0, 1], "rs-vs-bo"),
        ([0, 2], "rs-vs-asha"),
        ([1, 3], "bo-vs-mobster"),
    ]:
        plot_params.subplots = SubplotParameters(
            nrows=1,
            ncols=2,
            kwargs=dict(sharey="all"),
            subplot_indices=indices,
            titles=[SETUPS[ind] for ind in indices],
        )
        results.plot(
            benchmark_name=benchmark_name,
            seed=seed_to_plot,
            plot_params=plot_params,
            file_name=f"./odsc-learncurves-{name}-seed{seed_to_plot}.png",
        )